Chart USD/ZAR Update: Balanced above critical support
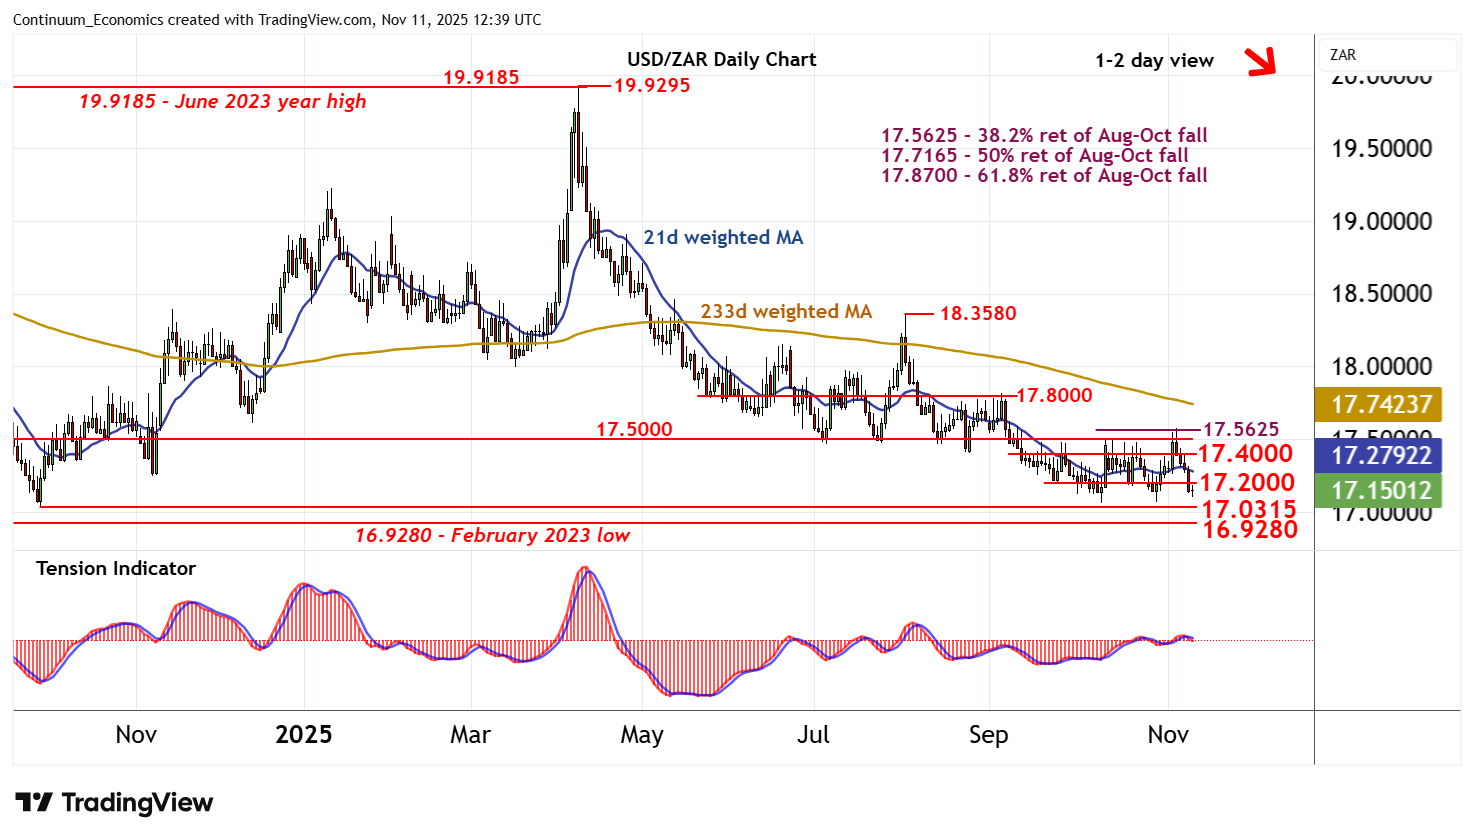
Anticipated losses have bounced from above critical support at the 17.0630 current year low of 9 October and the 17.0315 year low of 30 September 2024
| Level | Comment | Level | Comment | |||||
|---|---|---|---|---|---|---|---|---|
| R4 | 17.5625 | ** | 38.2% ret of Aug-Oct fall | S1 | 17.0630 | * | 9 Oct YTD low | |
| R3 | 17.5000 | ** | congestion | S2 | 17.0315 | ** | 30 Sep 2024 (y) low | |
| R2 | 17.4000 | * | congestion | S3 | 17.0000 | ** | congestion | |
| R1 | 17.2000 | * | congestion | S4 | 16.9280 | February 2023 low |
Asterisk denotes strength of level
12:15 GMT - Anticipated losses have bounced from above critical support at the 17.0630 current year low of 9 October and the 17.0315 year low of 30 September 2024, as oversold intraday studies unwind, with prices currently trading around 7.1500. Daily readings continue to fall and broader weekly charts are under pressure, highlighting room for further losses in the coming sessions. A close beneath here will add weight to sentiment and confirm continuation of May 2023 losses, with focus turning to the 16.9280 low of February 2023. Meanwhile, resistance remains at congestion around 17.4000 and extends to 17.5000. This range should cap any immediate tests higher.