Chart USD Index DXY Update: Prices remain under pressure
Little change, as mixed intraday studies keep near-term sentiment cautious and extend consolidation around support at the 99.56 weekly high of 9 October
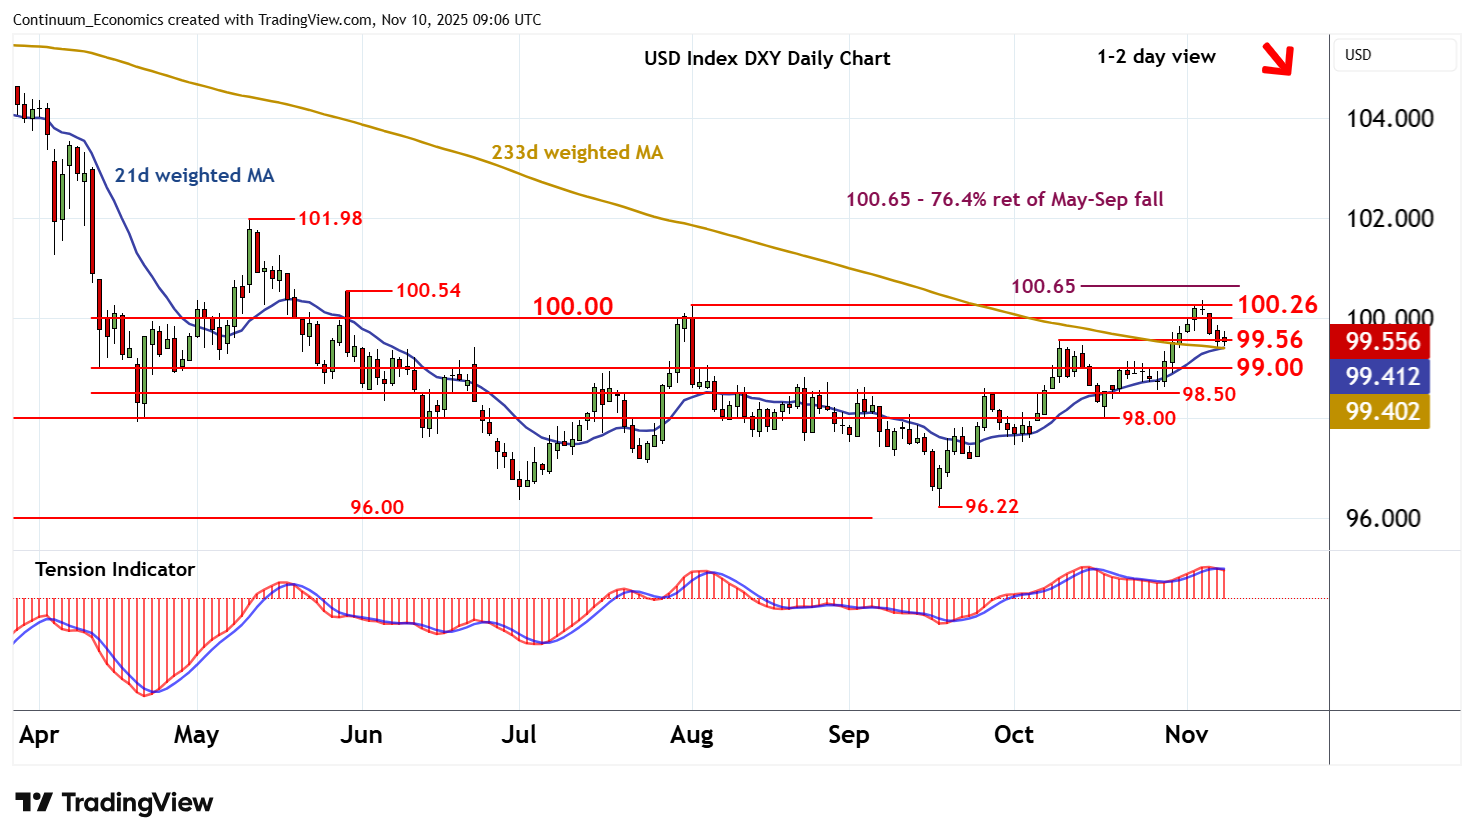
| Levels | Imp | Comment | Levels | Imp | Comment | |||
|---|---|---|---|---|---|---|---|---|
| R4 | 100.65 | ** | 76.4% ret of May-Sep fall | S1 | 99.56 | ** | 9 Oct (w) high | |
| R3 | 100.54 | ** | 29 May (w) high | S2 | 99.00 | * | congestion | |
| R2 | 100.26 | ** | 1 Aug (m) high | S3 | 98.50 | * | congestion | |
| R1 | 100.00 | ** | congestion | S4 | 98.00 | * | congestion |
Asterisk denotes strength of level
09:00 GMT - Little change, as mixed intraday studies keep near-term sentiment cautious and extend consolidation around support at the 99.56 weekly high of 9 October. Daily readings are falling and overbought weekly stochastics are flattening, suggesting room for fresh losses in the coming sessions. A break below 99.56 will open up congestion around 99.00. But the rising weekly Tension Indicator should limit any initial tests in short-covering/consolidation. Meanwhile, resistance remains at congestion around 100.00 and extends to the 100.26 monthly high of 1 August. A close above here is needed to improve sentiment and extend mid-September gains initially to the 100.54 weekly high of 29 May and the 100.65 Fibonacci retracement.