Published: 2025-11-11T02:54:23.000Z
Chart USD/MYR Update: Extending losses
1
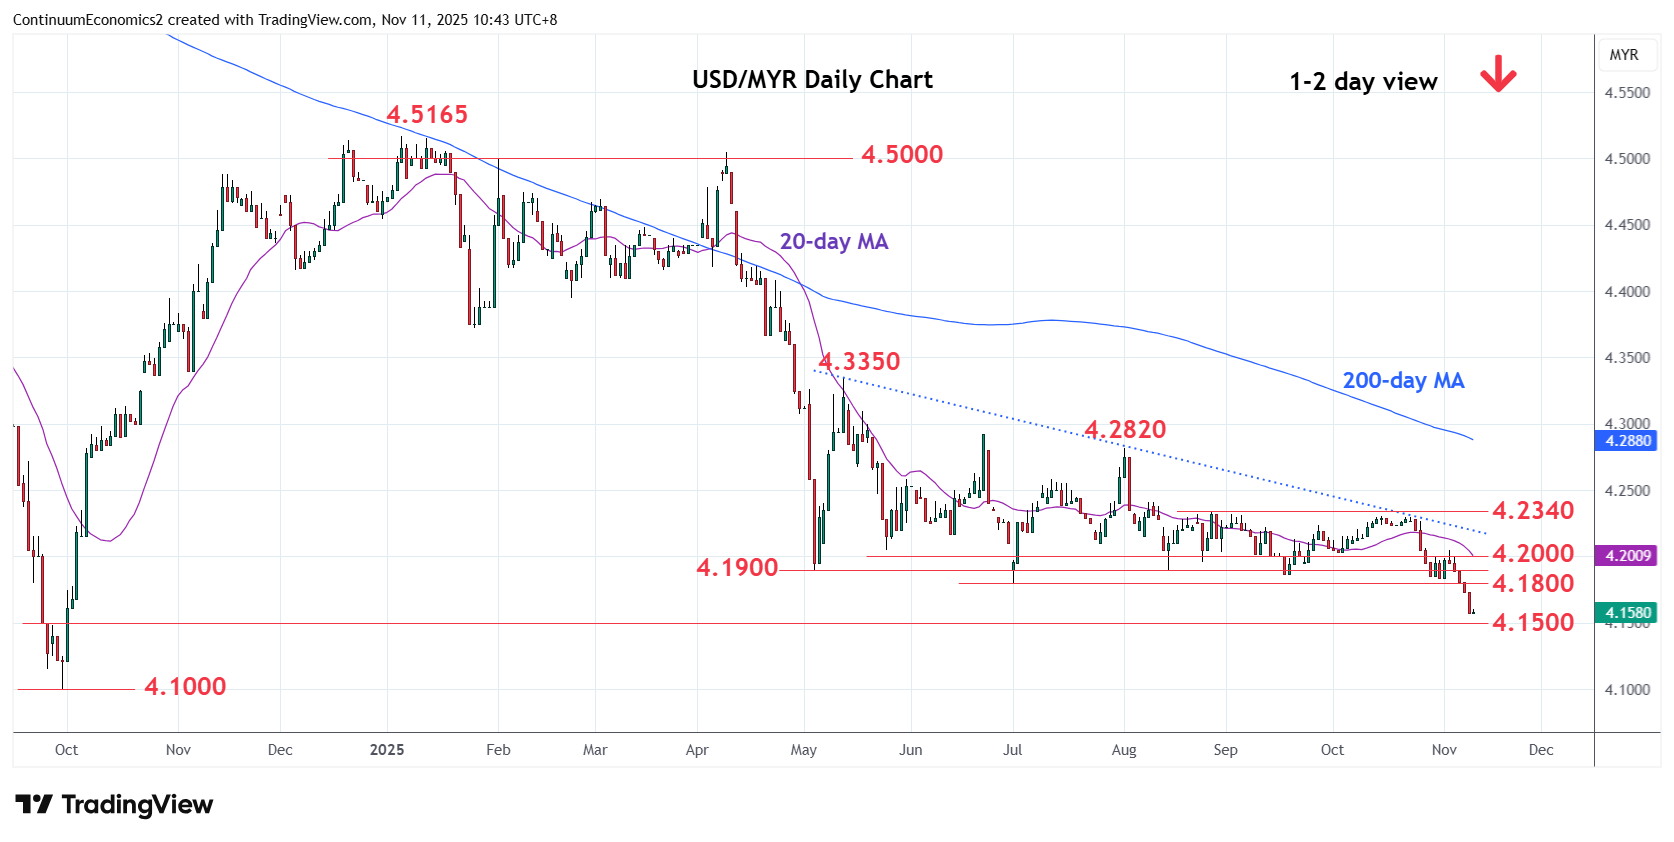
Break of the 4.1900/4.1800 May/July lows has seen losses to reach fresh year low at 4.1570
| Levels | Imp | Comment | Levels | Imp | Comment | |||
|---|---|---|---|---|---|---|---|---|
| R4 | 4.2300/40 | ** | congestion, 27 Aug high | S1 | 4.1500 | * | congestion | |
| R3 | 4.2230 | * | 21 Oct low | S2 | 4.1150 | * | 25 Sep 2024 low | |
| R2 | 4.2000 | * | congestion | S3 | 4.1000 | ** | Sep 2024 year low | |
| R1 | 4.1800 | * | Jul low | S4 | 4.0900 | * | Apr 2021 low |
Asterisk denotes strength of level
02:50 GMT - Break of the 4.1900/4.1800 May/July lows has seen losses to reach fresh year low at 4.1570. Consolidation here see prices unwinding oversold intraday studies but bearish momentum keep pressure on the downside. Nearby see support at the 4.1500 level. Below this, but not seen for now, will turn focus to the 4.1000, September 2024 year low. Stretched daily studies caution corrective bounce but strong resistance at the 4.1800/4.2000 recent lows are expected to cap corrective bounce.