Chart EUR/CAD Update: Leaning lower
The anticipated test of congestion resistance at 1.6300 has met selling interest
| Level | Comment | Level | Comment | |||||
|---|---|---|---|---|---|---|---|---|
| R4 | 1.6500 | ** | figure, historic congestion | S1 | 1.6200 | * | congestion | |
| R3 | 1.6468 | * | 17 Oct YTD high | S2 | 1.6135~ | 3 Nov low | ||
| R2 | 1.6400 | * | break level | S3 | 1.6115 | ** | 50% ret of Jul-Oct rally | |
| R1 | 1.6300 | * | congestion | S4 | 1.6100 | * | congestion |
Asterisk denotes strength
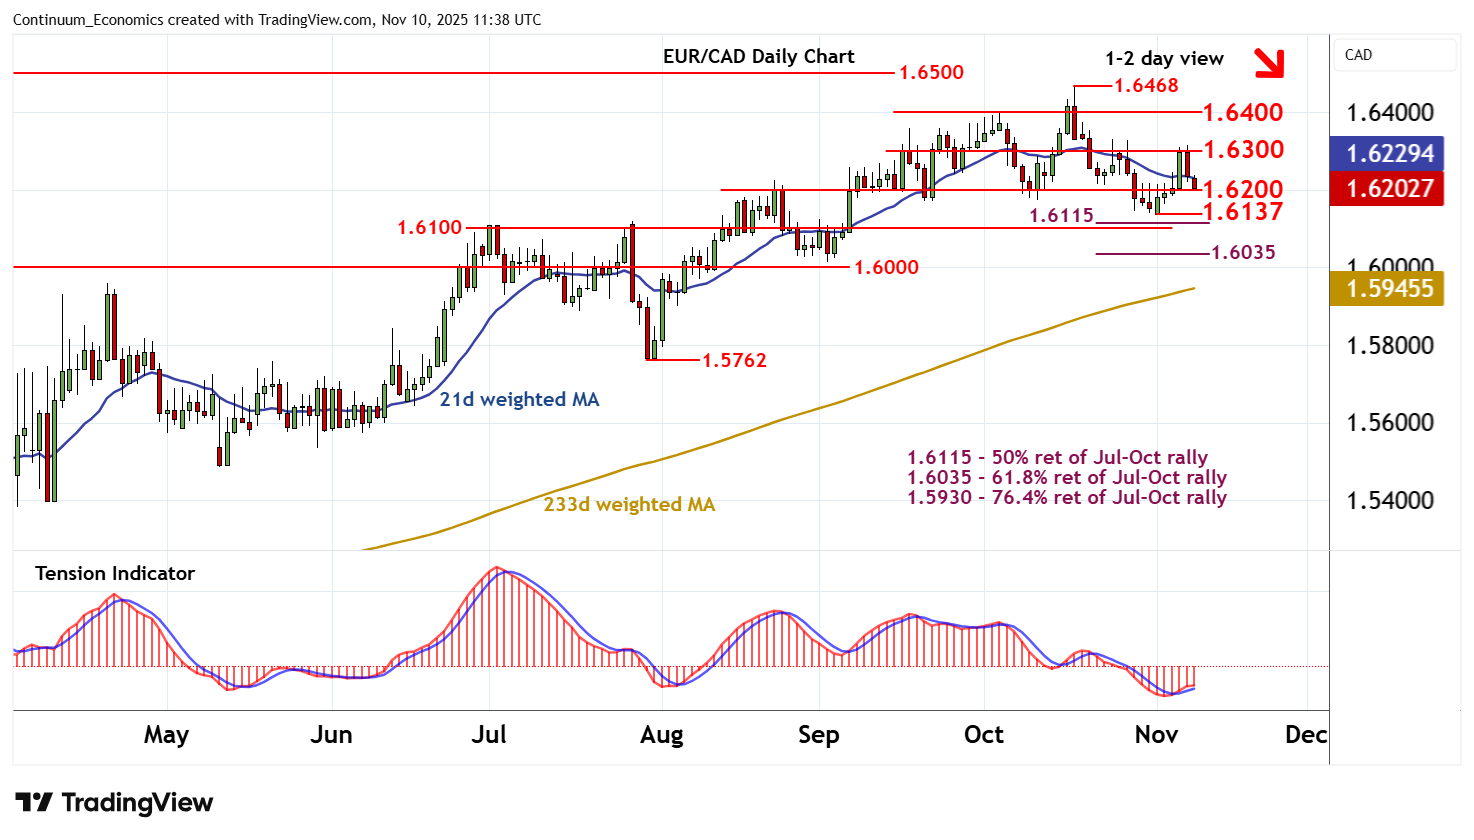
11:20 GMT - The anticipated test of congestion resistance at 1.6300 has met selling interest, with prices falling steadily to congestion support at 1.6200. Rising daily readings are flattening, suggesting a minor deterioration in sentiment and room for further losses in the coming sessions. A break will open up strong support within 1.6100/15 - 1.6135~. However, oversold weekly stochastics are flattening, suggesting any initial tests could give way to consolidation, before bearish longer-term readings prompt further losses. A close beneath here will add weight to sentiment and extend mid-October losses towards the 1.6035 Fibonacci retracement. Meanwhile, resistance remains at 1.6300 and should cap any immediate tests higher.