Published: 2024-11-18T16:58:57.000Z
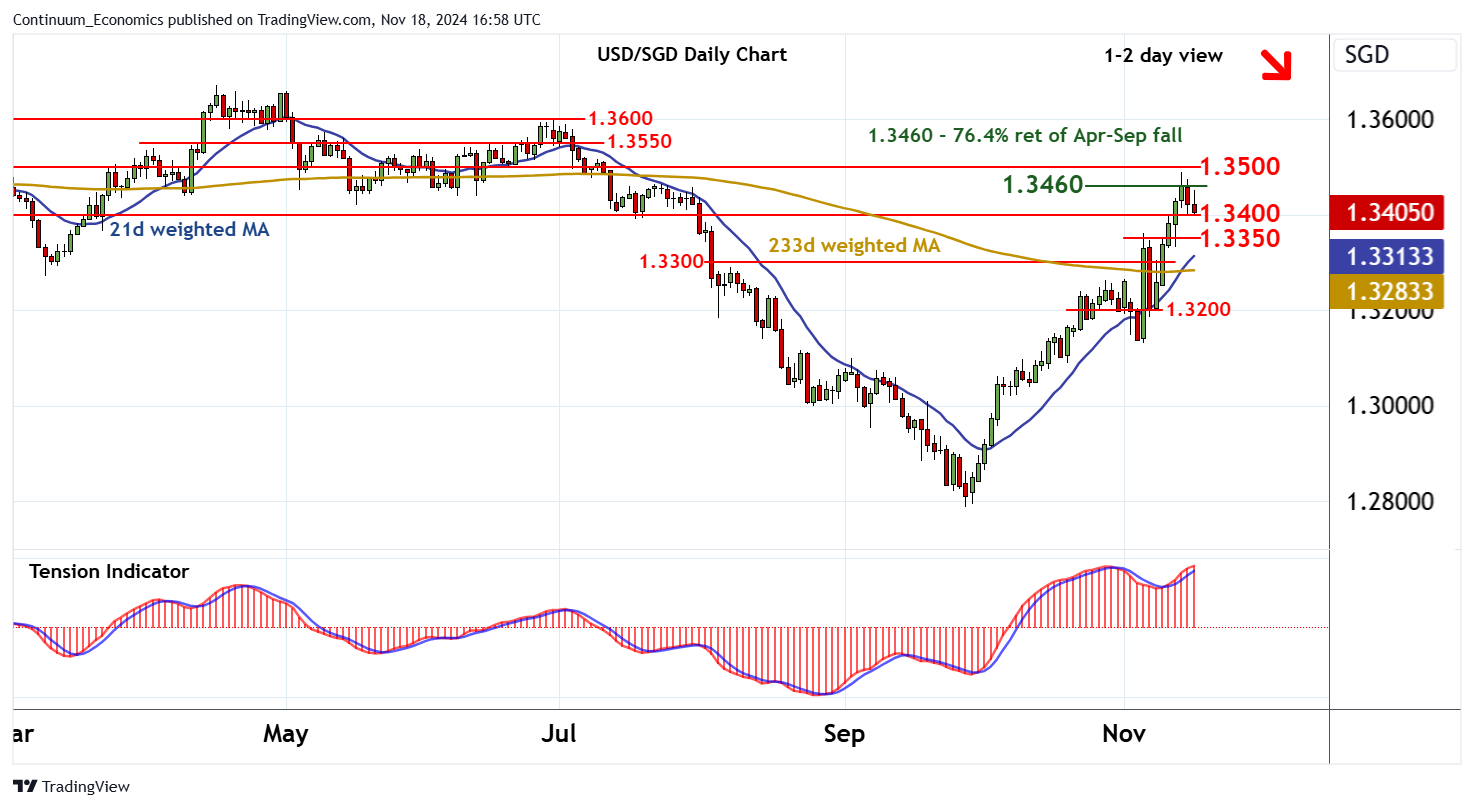
Chart USD/SGD Update: Under pressure

Senior Technical Strategist
-

Still little change, as prices extend consolidation above congestion around 1.3400

| Level | Comment | Level | Comment | |||||
|---|---|---|---|---|---|---|---|---|
| R4 | 1.3600 | ** | break level | S1 | 1.3400 | * | congestion | |
| R3 | 1.3550 | * | break level | S2 | 1.3350 | * | break level | |
| R2 | 1.3500 | ** | congestion | S3 | 1.3300 | * | congestion | |
| R1 | 1.3460 | * | 76.4% ret of Apr-Sep fall | S4 | 1.3200 | * | congestion |
Asterisk denotes strength of level
16:50 GMT - Still little change, as prices extend consolidation above congestion around 1.3400. Intraday studies are negative and overbought daily stochastics are flattening, suggesting potential for a test beneath here. But the rising daily Tension Indicator and positive weekly charts are expected to prompt renewed buying interest towards 1.3350. Meanwhile, a close above the 1.3460 Fibonacci retracement would help to improve sentiment and extend September gains towards congestion around 1.3500. But already overstretched daily readings should limit any further gains in profit-taking towards 1.3550.